
- NHL – National Hockey League
- Sports
- Audience for data includes, statistical crew, team players, and coaches to improve team stats.
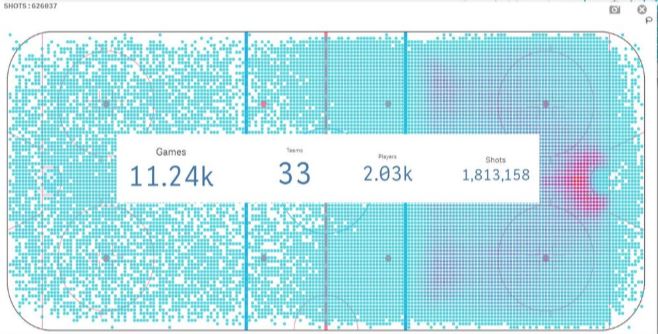
The Qlik Sense site application that I chose as my favorite was a data set on NHL hockey shots. As a person who is not a big sports lover but a person who appreciates statistical data, it really intrigued me that sports data is a thing! The data takes over 1.8 million shots that were taken from 9 seasons of the NHL Hockey league to analyze the best locations for goals and blocks. As you can see in Figure 1 from above, the scatter chart is laid out on a hockey rink to make the data that much more accurate.
My favorite things about this application is the deep data that has went into creating accurate statistics. This hockey analyzer includes goals from past games, the location that shots were blocked, number of shots taken and from where, and even the amount of missed shots on the rink. The most intriguing part about these collections is that includes data from over 11,000 games that partook over the years. After discovering an application that exists for sports data I have concluded that Qlik Sense can work for any industry and any statistics that need to be gathered and analyzed. Having the access to this sorts of data can increase the advantage of the quality of team stats and play just as it would for any other company.
